How is my feature doing?
Tl;dr
- I discuss how the effort to answer the question "how is my feature doing?" is often misguided
- Such efforts often focus on "funnel" and "segment" analyses, which can be misleading and are usually not actionable
- I discuss a more useful approach, which is to run a heterogeneous treatment effect (HTE) analysis on experimental data
Introduction
Suppose we are assigned to a particular feature of a product: the checkout flow, a tab in the mobile app, the “AI DJ”, etc. Someone above our pay grade asks us: is the feature doing well? How might we respond?
The most basic level of analysis is to construct a set of “health metrics” and report on those. The weekly active users is W. X% of users who use the feature in week 1 use it again in week 2. The feature gets Y new impressions every week, and those yield Z new weekly active users.
One problem with this approach is that we haven’t really answered the question. We’ve reported on a set of metrics, but we haven’t provided a corresponding value judgment. 10 million weekly active users might be good, or bad, depending on a number of factors: the age of the feature, how much money we’re spending on paid marketing, the total addressable market, etc. We need not just health metrics but also something to compare them to.
So typically each health metric is accompanied by a target. Unfortunately, it is rare that a data scientist constructs these targets. And, confusingly, the target might represent either a prediction or an aspiration. If the business progresses as usual, we expect WAU to hit 10 million. That’s a prediction. But if we want WAU to reach 20 million instead, that’s an aspiration. Rarely are business leaders happy with business as usual.
For now, I’ll ignore the “happy path”, wherein a feature manages to hit its targets for each of its health metrics. (Even if this is possible for months, or even years, eventually growth flattens out or targets increase.) Suppose instead we’re traveling down the unhappy path. Health metrics aren’t meeting their targets, and the feature isn’t doing well relative to expectations. Diagnosing the issue is usually data science’s responsibility. If the feature is unhealthy, why is that?
Funnels and segments
The approach I’ve seen most often in the industry is composed of two separate but related analyses. I’ll call them “funnels” and “segments”. In a funnel analysis, we decompose the feature into its constituent parts. In a segmentation analysis, we decompose the population.
Funnel analysis
Here’s an example. Suppose we’re interested in learning whether the checkout flow is “doing well”. Suppose checkout has two pages. On the first, the customer views their cart, and on the second, they enter their shipping information, payment details, and actually place the order. (Real checkout flows can be a lot more complicated, of course.) If our health metric is “number of orders placed”, we can decompose that into three sub-metrics: the number of “page 1” (view cart) impressions, the number of “page 2” (shipping/payment) impressions, and the number of orders placed. The rates of dropoff between each step can be multiplied together to give an overall “success rate”. See illustration below.

Because there are decreasing numbers of users at each step, this is called a “funnel analysis” (the population shrinks from left to right, like a funnel turned on its side). In a more sophisticated analysis, we might come up with more intermediate steps (fills out shipping information but not payment details, places order but credit card fails, etc.), but reasoning about a simplified flow is easier, here.
Immediately a few problems with funnel analyses become apparent. First, decomposing one overall metric into N sub-metrics can complicate more than it simplifies. Instead of needing to answer the question “why isn’t the overall metric hitting its target?” we need to answer N sub-questions: “why aren’t these N sub-metrics hitting their N sub-targets?”. That’s provided we can even set these sub-targets sensibly, which is no easy task.
A second issue is that funnel analyses often tacitly assume some sort of “all other things being equal” condition. If we can reduce the dropoff rate at some stage of the funnel, while keeping all other dropoff rates the same, we’ll profit. But it’s not that easy to keep all other things equal! For example, having more users visit checkout page 1 increases the “top of the funnel”. But it’s likely these additional users have lower propensity to checkout, so “lower funnel” dropoff rates might decrease, partially or totally counteracting any beneficial effect. Or, to take another example, providing more entrypoints into a particular part of the funnel might cannibalize existing ones.
A final issue is that, when these sub-metrics do change, it’s not obvious whether it’s our doing or not. (“Men at sometime are masters of their fates”, as Shakespeare wrote.) Funnel metrics can change because our product changes. But they can also change because the audience using the product is changing. More organic or paid users; more new or tenured users; more users from Western or non-Western countries; more mobile or desktop users; or simply the same users, acting differently — each of these factors can drive changes in funnel metrics, even if the feature remains exactly the same. A/B tests can help tease apart effects that are in our stars from ones that are in ourselves. But it is not that easy to prove, to anyone’s satisfaction, that a certain number going up, or down, is our doing or not.
Segmentation analysis
One way of trying to gain more insight is to control for these “audience” effects. We can measure, in theory, the number of organic and paid users, new and tenured users, etc. So we can decompose the overall metric not just into funnel steps, but also into "segments". See illustration below.
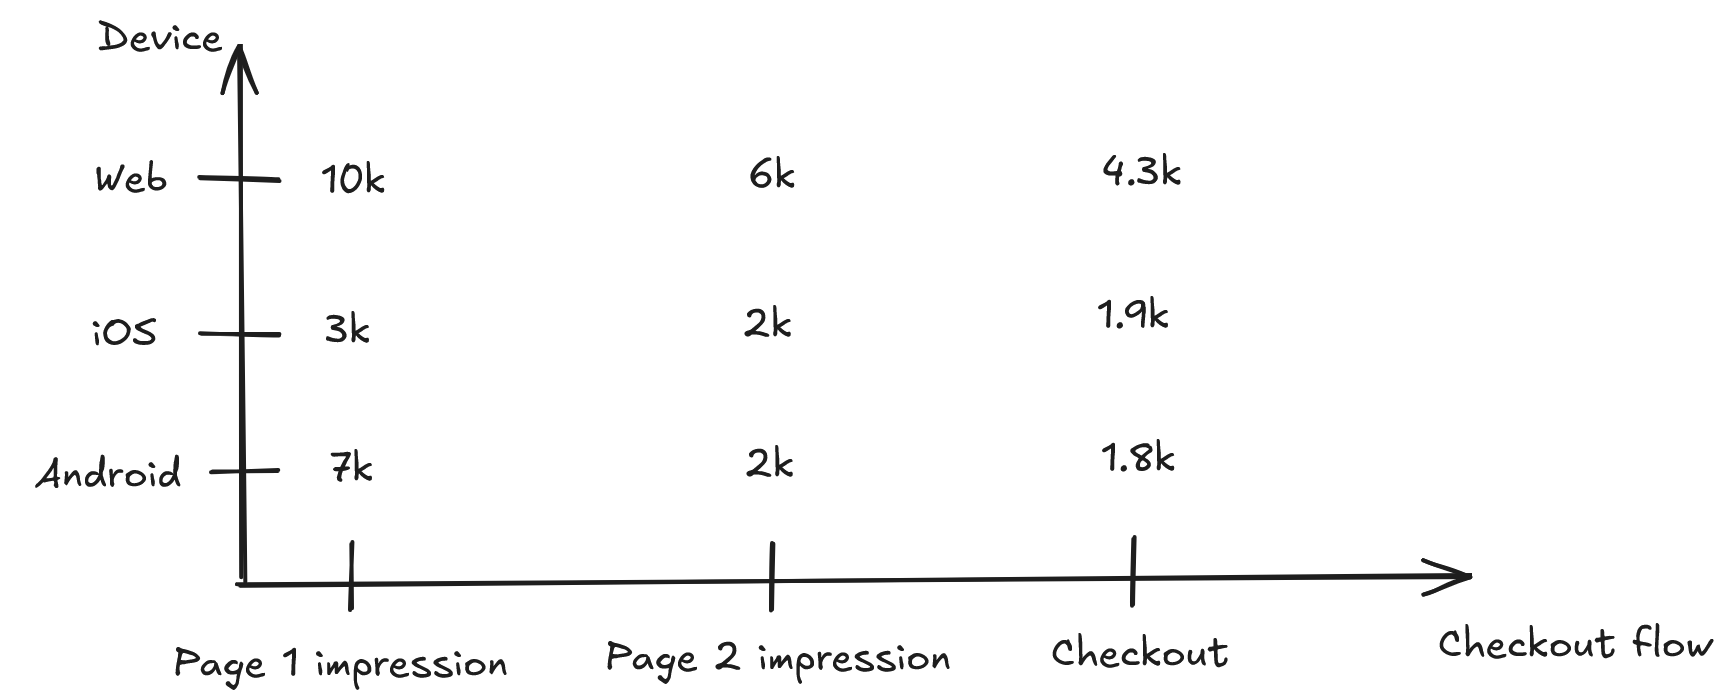 This is for a single segmenting feature (”device”), with many possible values (the segments themselves). But, presumably, we can have as many segmenting features as we have independent data points about our users. We can segment by acquisition source, device, country, past web usage, past order history, and so on.
In doing so, we make the problem geometrically more complicated. We started with one health metric and one target. Now we have potentially hundreds of health metrics, and hundreds of targets. (One for each combination of segmenting feature, segment, and funnel step.) Is this useful, or have we simply generated more numbers with which to populate slide decks?
Even when trying to control for audience behavior, the same issues I mentioned above arise again. It’s even less obvious how to set dozens or hundreds of targets. If a particular segment moves, is that because of an exogenous or endogenous factor? What about aspects of the audience we can’t measure? And what about multicollinearity, where two segmenting features are highly correlated with each other? One-dimensional “cuts” can also obscure interaction effects, but measuring interactions only further increases complexity.
Segmentation analysis is often trivial and rarely profound. We end up with statements like “iOS users have better activity and retention metrics than Android users”. Even if that is true, how does it help us optimize the product? Such correlations are rarely actionable. If iOS users exhibit better metrics, it might be because having an iPhone or iPad is a proxy for income, and higher income users tend to have better metrics than lower income ones. It doesn’t necessarily mean that encouraging iOS usage (whatever that means) would help achieve the company’s goals.
Some caveats
I don’t mean to imply that all analyses of this type are useless. I find they’re most useful as part of one of three categories. The first is uncovering “bugs”. These are cases where metrics (particularly rates) are implausibly low, or at least very much lower than a corresponding metric for a different segment. If a metric is 20% on Android but 90% on iOS, the difference probably can’t be attributed solely to income effects. There might a bug on Android that the engineers should look into. That being said, these types of discoveries are not that common and they often require a time-intensive “fishing expedition” to uncover.
In the second case, we have a specific hypothesis we want to test. For example, "we changed page 2 of the checkout flow for non-credit card users on Feb 26". In this case, we can isolate a particular funnel step, and a particular segment, at a particular point in time. Then, we might do a pre-post comparison to see if we messed things up at that step, for that segment, at that time. Note, though, that this isn’t the usual “see what you can find” adventure inspired by a vague question (”how is the feature doing?”). Rather, it’s a highly specific theory that is eminently testable and falsifiable.
The final case involves understanding how a target might even be achieved. If we currently have 20k page 1 impressions and 8k success checkouts, but our target is 20k checkouts, it becomes obvious that optimizing the stage 2 and 3 dropoff rates isn’t enough. We also have to drive more users to the top of the funnel. And we get a sense of the order of magnitude of improvement required, which can help PMs understand what kind of bets to make (are a series of small but safe incremental improvements enough, or do we need more radical change?)
But apart from bug bashing, hypothesis testing, and impact sizing, these analyses are just not that useful. The benefits usually don’t outweigh the costs. Depending on how poorly the data warehouse is structured, and how bespoke the segments and funnel steps are, even pulling the data itself can take days, if not weeks. Analyzing it — not just doing aggregations, but trying to tease apart causation from correlation, exogeneity from endogeneity — can take even longer. I’ve seen companies spend months monitoring and dissecting health metrics, with very little to show for it. (Besides leadership being assuaged that we’re thinking deeply about the problem, which is often what matters most.)
Who should we target?
Marx once wrote, “The philosophers have only interpreted the world, in various ways. The point, however, is to change it.”
Data scientists are like Marx’s philosophers. We interpret the metrics; we do not change them. And exercises like segmentation and funnel analyses are very good at generating interpretations (lots of them!) but less good at driving product change: at closing the gap between where a metric is and where we’d like it to be.
Suppose the best case scenario: we have a magic 8-ball that allows us to say, for any particular user, how likely they are to drop off at a particular funnel step. Here we’re assuming not only that we have a perfect statistical or ML model, but also that all information needed to compute these probabilities is observable (no unmeasurable/hidden confounders). Even in this case, where we can compute segment metrics perfectly, it’s not totally obvious what we should do, from a product perspective.
Consider the schematic below.
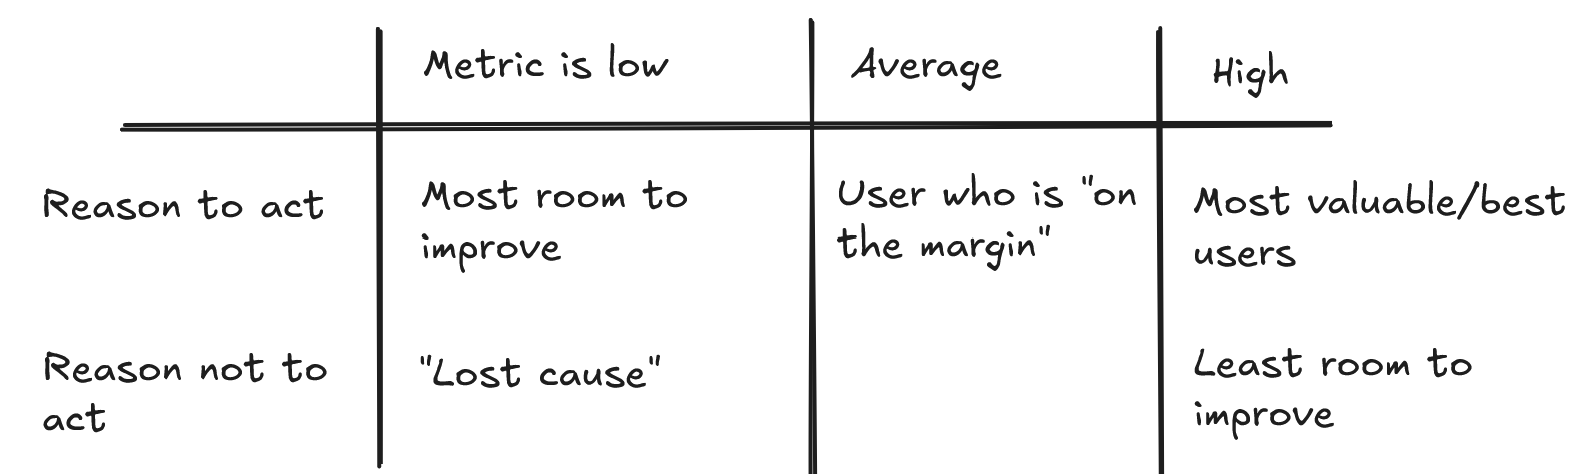
I’ve tried to generate a list of reasons to target a particular user (or segment), given their probability of successfully navigating a funnel step. (For example, their probability of checking out successfully.)
It’s not that difficult to provide arguments for both sides! We often assume that we should target users in low performing segments, where there is a large gap between actual and expected metrics. But, conversely, these might be the users we don’t want to target, since they might be a poor fit for our product (a “lost cause”). It’s very difficult to know a priori which situation we’re in. If Android users have poor metrics, is that because the app experience on Android is bad, or because they don’t have enough income to use our product? The same goes for the opposite end: a high performing segment. Some businesses make most of their money from “whales”: a small sliver of the population that accounts for a large percentage of revenue. But, at the same time, it is difficult to extract even more out of a segment that performs so well already. (Not that these companies don't try.)
If the situation is this bad in the best case scenario, with no hidden confounders and an AUC of 1.0, it’s even worse in real-life, where neither of these conditions holds. To underscore the point: even the best predictive model (using the best features and best algorithm) applied to a particular funnel step tells us very little about how to optimize that funnel step, or how much we might gain by doing so. If we could predict checkouts perfectly, that doesn’t get us as much as we’d like. And of course we can’t predict checkouts perfectly.
The fact that different segments of users perform differently is sometimes given as a reason to personalize the feature based on user segment. This is simply a logical error. For personalization to work well requires that we have “heterogeneous treatment effects”. In other words, if everyone responds better to variant B than variant A, we should simply show variant B to all segments. And if variant B is no better than variant A for all segments, we shouldn’t ship it. It’s only in the case that variant B is better for some segments, and worse for others, that personalization matters. A heterogeneous experience should require heterogeneous effects.
In fact, this is one of the best applications of segment and funnel analysis, and one that I’ve rarely seen in my day-to-day work. It goes like this:
- Generate a few variants for a feature, or its subcomponent (like a particular funnel step)
- Run a (preferably overpowered) A/B/C… test on these variants. (Accept that you might have to incur some short term losses to do so.)
- Then, run a heterogeneous treatment effect analysis (which requires overpowering) to see which segments were stat-sig better, or worse, for particular variants. If there are none, then personalization is probably a dud. If there are, and if the effect sizes are noteworthy, it’s worth investigating further.
Closing thoughts
Comparing metrics to their targets, and the “segmentation” and “funnel” analyses that accompany this effort, is rarely very useful, and is often downright useless. Although this kind of work can make CEOs happy, it struggles to be actionable — to guide product thinking. There are a number of problems: exponentially-growing complexity as funnels become more intricate and segments multiply; inability to distinguish between exogenous and endogenous effects; dubious “all other things being equal” or “no cannibalization” assumptions; and difficulties translating segment performance into recommendations for which segments to target. Even if we have every segmenting feature we’d like, and a perfectly predictive ML model, we typically still struggle to bridge the gap between what these analyses provide (correlation) and what we want (causation).
I’ve offered one strategy for making funnels and segments great. (Not again, since they weren’t great in the first place.) This involves using them to power heterogeneous effects analyses in experiments that measure a particular funnel metric. But even if you don’t have the resources to do that, it’s worth remembering: segments and funnels are useful only insofar as they change the world, and you need an A/B test to measure that. And if you’re going to run an A/B test, do you really need a segmentation or funnel analysis, let alone a very involved one?